




From raw image to
actionable intelligence,
in one configurable pipeline
Our multimodal platform capabilities span image QC, segmentation, quantification, spatial feature extraction, and cross-modal integration. Each is built to generalize across panels, plexes, and tissue sources, and to link back to the clinical question at hand.
A Configurable
Spatial Feature Library
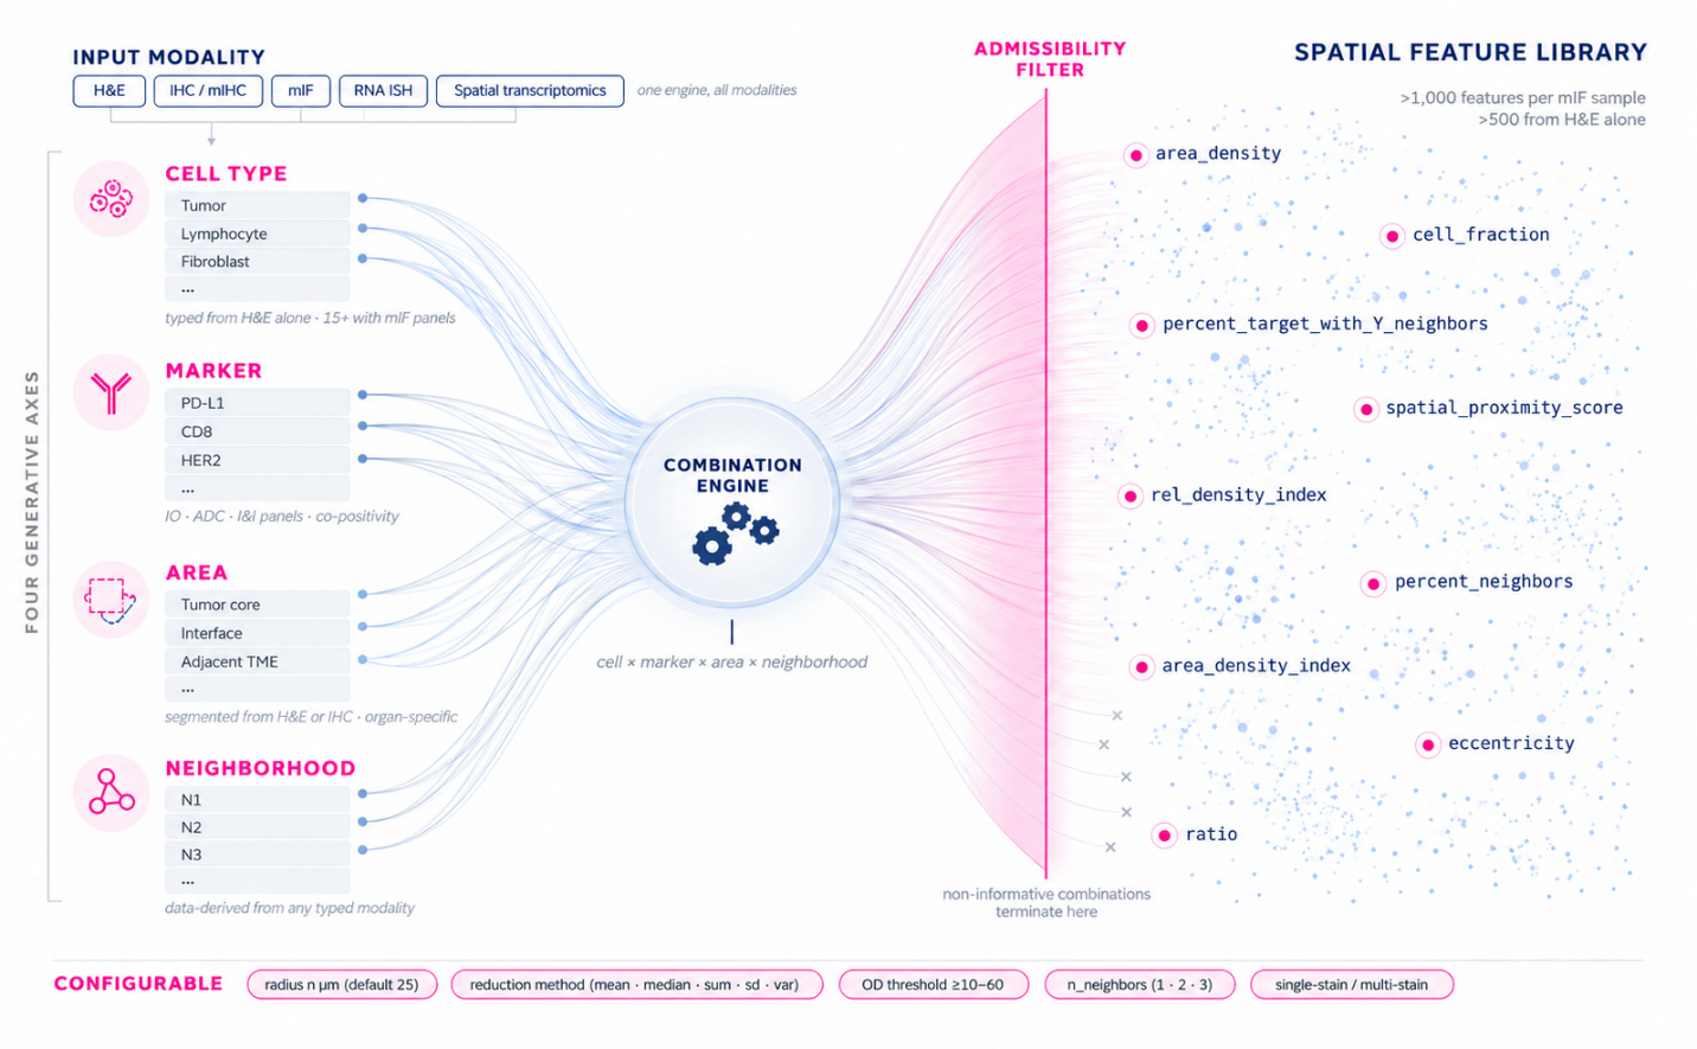
One engine, every modality. H&E, IHC, multiplex imaging, and spatial transcriptomics all run through the same feature engine. Cell typing and area segmentation and neighborhood discovery work from H&E alone; protein & RNA markers add depth where your assay provides them.
H-score, percent positivity, and TILS are still reported alongside the spatial context that explains them, with presets for common feature sets and a custom calculator for specific needs. And in higher-plex assays, the feature library is automatically filtered for informative combinations only. The result: over 1,000 features per mIF sample, and over 500 from H&E alone.

Segment and score
Supported modalities run through one pipeline. Each cell is scored continuously for:

- Membrane and cytoplasm optical density
- Morphometrics
- Functional state
- Marker co-expression

Spatial features
From there, hundreds to thousands of spatial features are available, including:
- Neighborhood composition
- Cell–cell and receptor–ligand proximity
- Immune contexture
- Spatial Proximity Score (a configurable radius and neighbor-count metric built to capture bystander effect).
1. Bloom K, et al. Generating virtual multiplex images from sequential immunohistochemistry (IHC) slides using deep learning [poster]. Presented at: Pathology Visions (PathVisions) 2022, Digital Pathology Association Annual Meeting; October 16–18, 2022; Las Vegas, NV.
2. Markovits E, et al. Predicting response to immune checkpoint inhibitors (ICI) in non-small-cell lung cancer (NSCLC) by combining spatial analysis of cells and RNA sequencing data from biopsies using deep learning (DL) [poster #1289]. Presented at: Society for Immunotherapy of Cancer (SITC) 37th Annual Meeting; November 8–12, 2022; Boston, MA.
Virtual Multiplexing
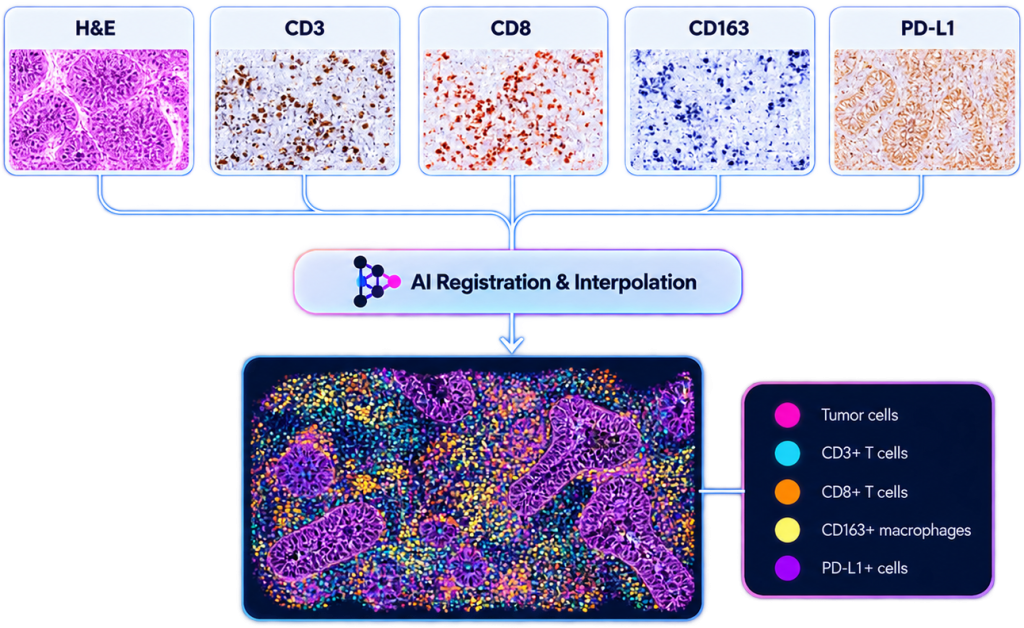
Multiplex IHC and mIF panels are expensive and slow to develop. Virtual multiplexing estimates cell-level co-expression from H&E and sequential single-stain slides, using deep learning instead of a custom assay.
How it works. An alignment model registers each IHC or mIF slide to its H&E slide at the cell level and assigns marker positivity to every H&E-detected cell, so one image shows which markers co-occur without staining the same section twice.
Results.
- In a 120-patient NSCLC cohort (H&E plus CD3, CD8, CD163 and PD-L1), our platform detected over 2.2 million lymphocytes and 150,000 macrophages, with 70% sensitivity and 90% specificity.¹
- In a retrospective 103-patient NSCLC conference study, pretreatment biopsies from responders showed closer PD-L1+ tumor–CD8+ T-cell proximity than those from non-responders (p<0.01).²
Same-Slide Sequential Staining
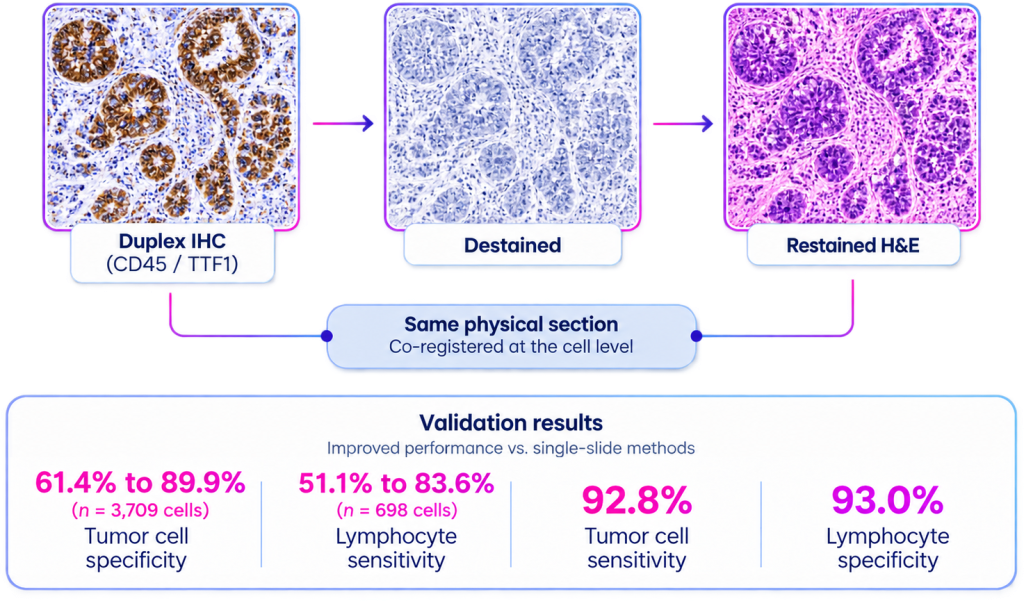
How it works. In small cell lung cancer, tumor cells and lymphocytes can look nearly identical on H&E to the pathologist eye. Re-staining a single section provides IHC-confirmed labels: an IHC stain (single, duplex, or triplex) is imaged, destained, then restained with H&E and imaged again. Both images come from the identical section, so they co-register cell by cell, and the IHC-confirmed labels retrain the H&E model, which then needs only a standard H&E slide.
Results. In a withheld SCLC validation cohort, this improved tumor cell specificity from 61.4% to 89.9% (n = 3,709 cells) and lymphocyte sensitivity from 51.1% to 83.6% (n = 698 cells) versus a model trained on H&E-only annotations, with tumor cell sensitivity (92.8%) and lymphocyte specificity (93.0%) held.³
3. Bloom K, et al. Development of a novel AI-augmented small cell lung cancer (SCLC) algorithm for accurately classifying cell types from H&E [poster]. Presented at: IASLC 2025 World Conference on Lung Cancer; September 6–9, 2025; Barcelona, Spain.
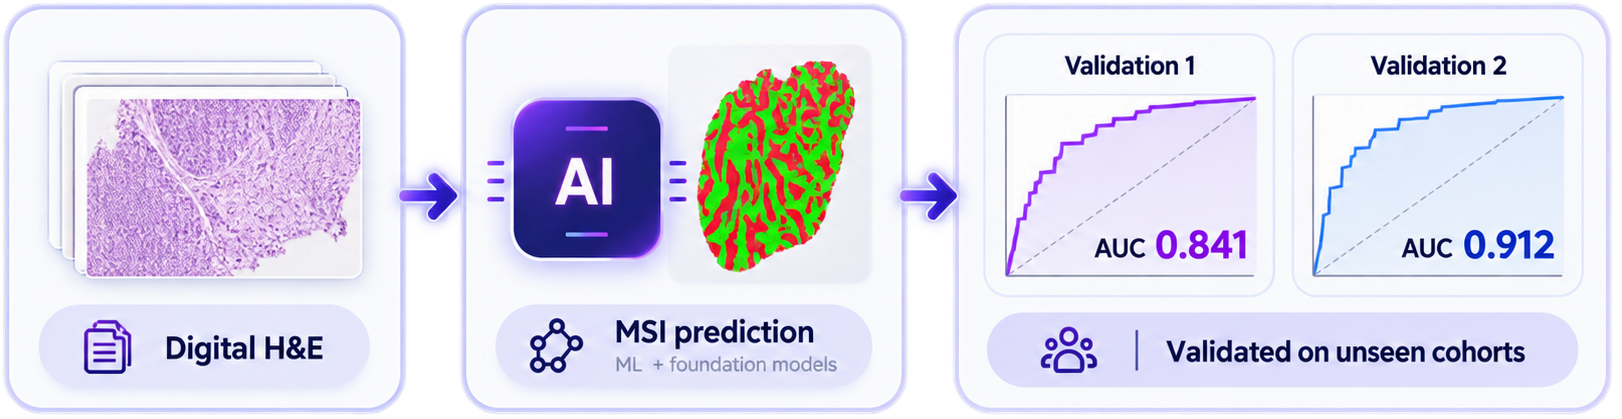
Nucleai Internal Validation Study. MSI-H prediction from routine H&E images validated across independent colorectal cancer cohorts (training cohort, N=320; combined external validation cohorts, N=426). Data on file.
Molecular & Biological Phenotype Prediction
Nucleai’s foundation models enable prediction of molecular and biological phenotypes directly from routine H&E images. This includes capabilities such as MSI-H prediction, with the potential to uncover clinically relevant biology without requiring additional tissue assays.
From Discovery to Deployment
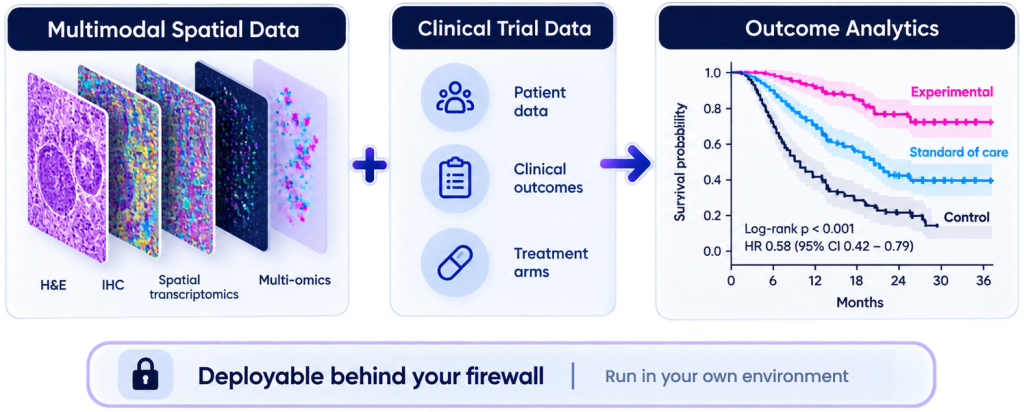
Findings do not stop at the feature layer. Unsupervised clustering and dimensionality reduction surface structure in a cohort’s spatial features. Clinical data is linked to support in-depth analysis:

Evaluate outcomes
Kaplan–Meier plots, response association and survival analyses evaluate features against study endpoints.

Work within sponsor constraints
Where outcome data cannot leave the sponsor environment, analysis can be performed by Nucleai and sponsor within that environment.

Support cohort derivation
The same pipeline supports cohort derivation from discovery through validation.

Trace every result back to the image
Identified features are traceable through an interactive viewer with per-cell overlays, hover values and exportable feature tables.
Ready to Unlock MOre from your Tissue Data?