

Purpose-built for
every modality,
and to read them together
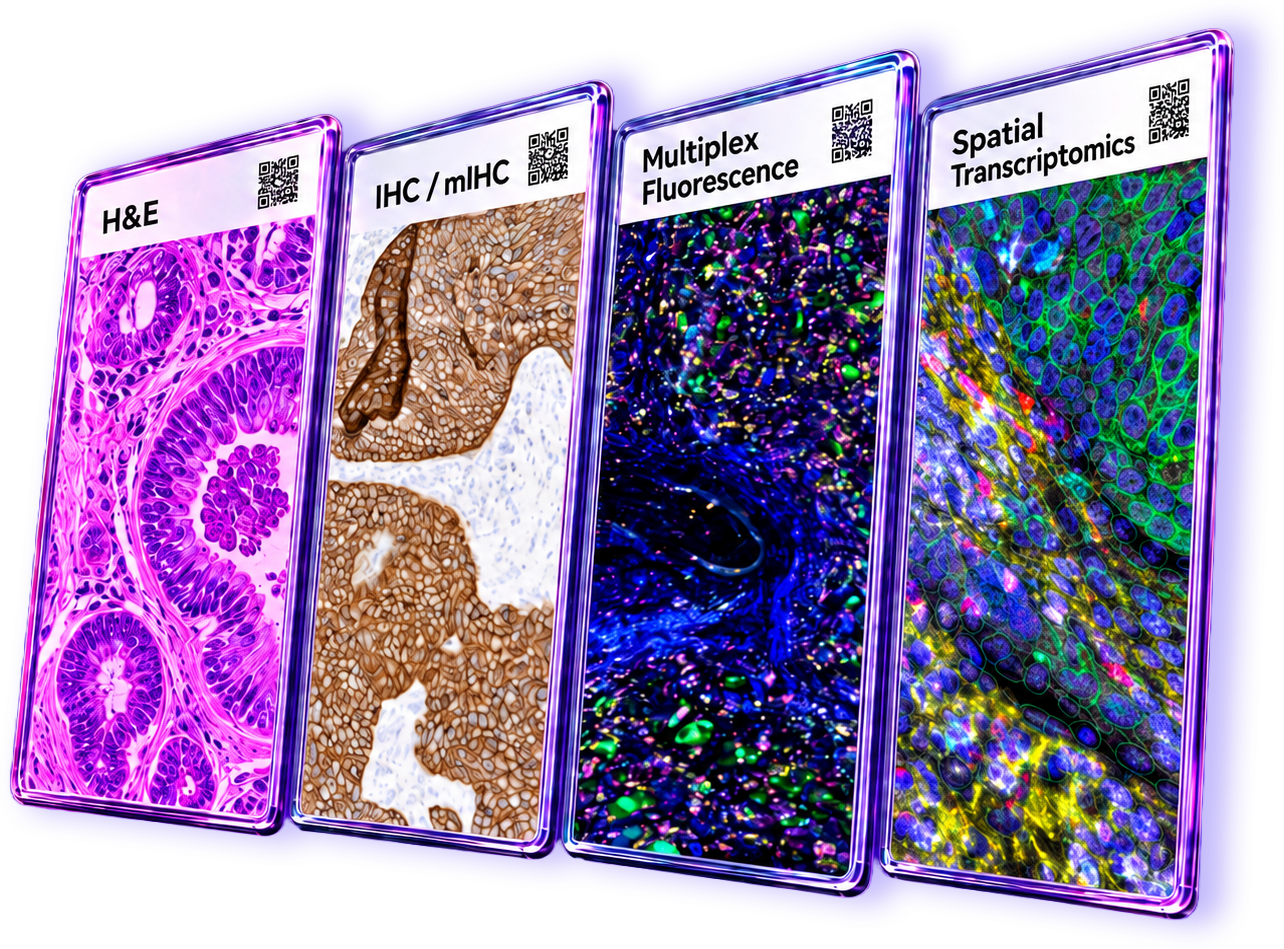
Nucleai applies a dedicated analytical approach to each data type— H&E, IHC, multiplex imaging, and spatial transcriptomics — then co-registers them into one dataset per patient.
Co-Registered, Not Just Covered
The platform pairs features across available modalities, including H&E, IHC, multiplex imaging and spatial transcriptomics, into a unified patient-level model.
Case Study
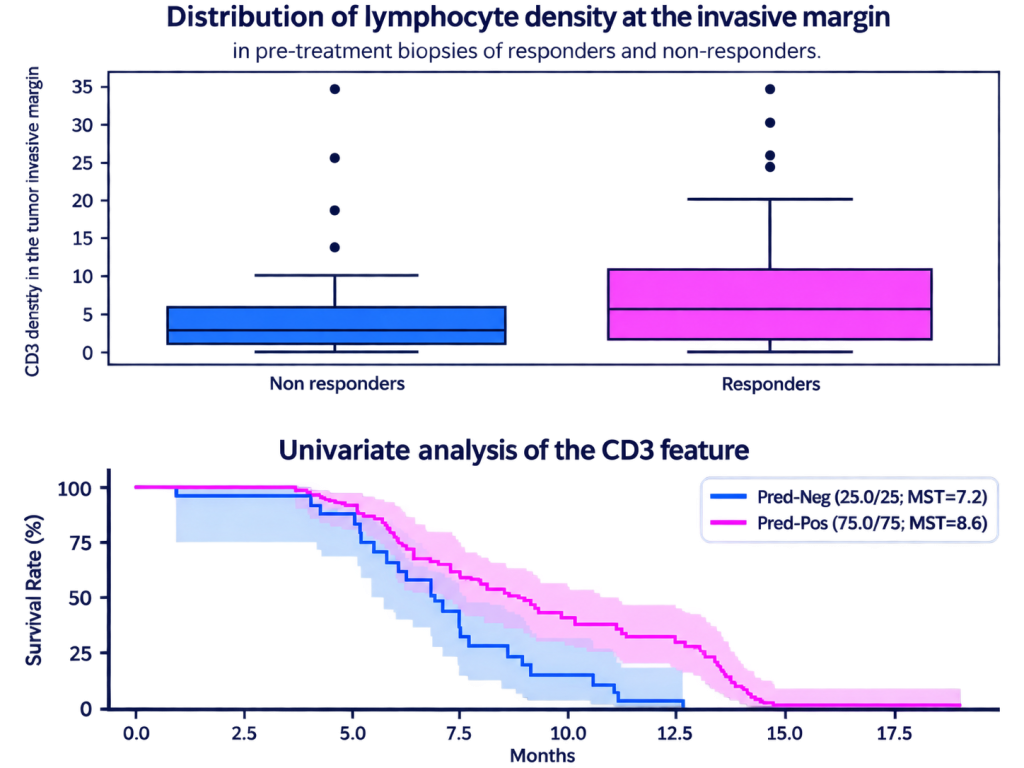
In a study with Genmab across 103 patients with non-small cell lung cancer treated with second-line immunotherapy, we combined H&E, 5 IHC markers, and RNAseq profiling from the same patients into a single multivariate model. Patients with a positive combined-model score showed longer progression-free survival than those with a negative score (HR 0.48)1.
1. Markovits E, et al. Predicting response to immune checkpoint inhibitors in NSCLC using multimodal spatial analysis and RNA sequencing. SITC 2022, Poster #1289.

103
patients

Non-small cell lung cancer

HR 0.48
Longer PFS with multimodal model
Case Study · Genmab Study Results
- Drag the slider to compare before and after.
H&E
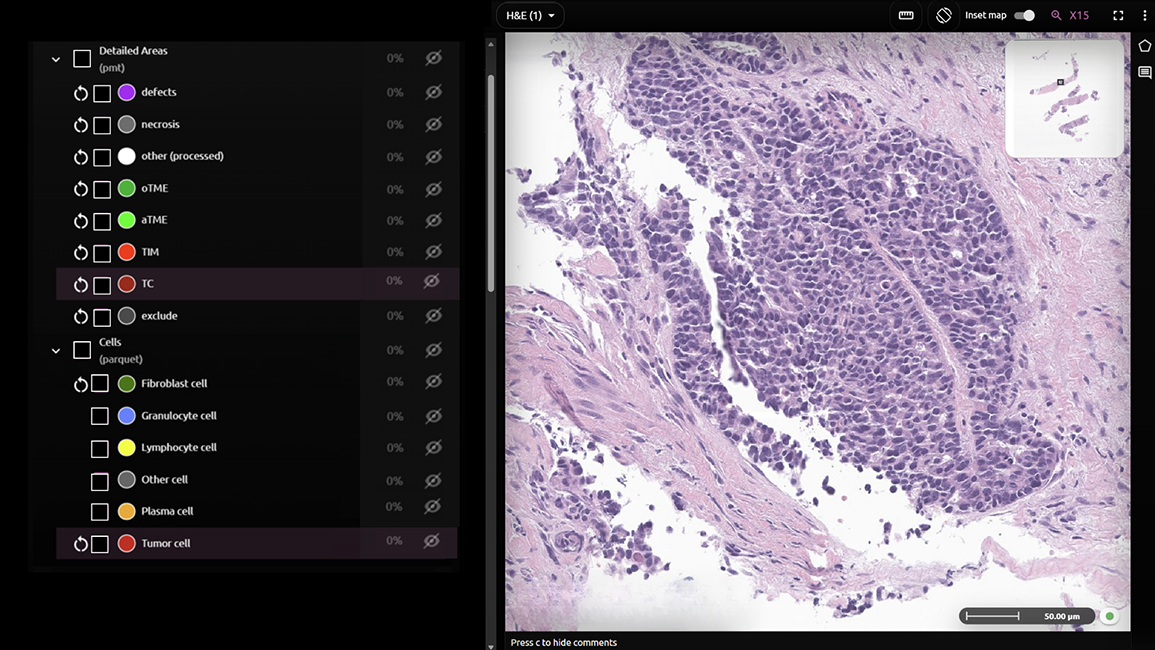
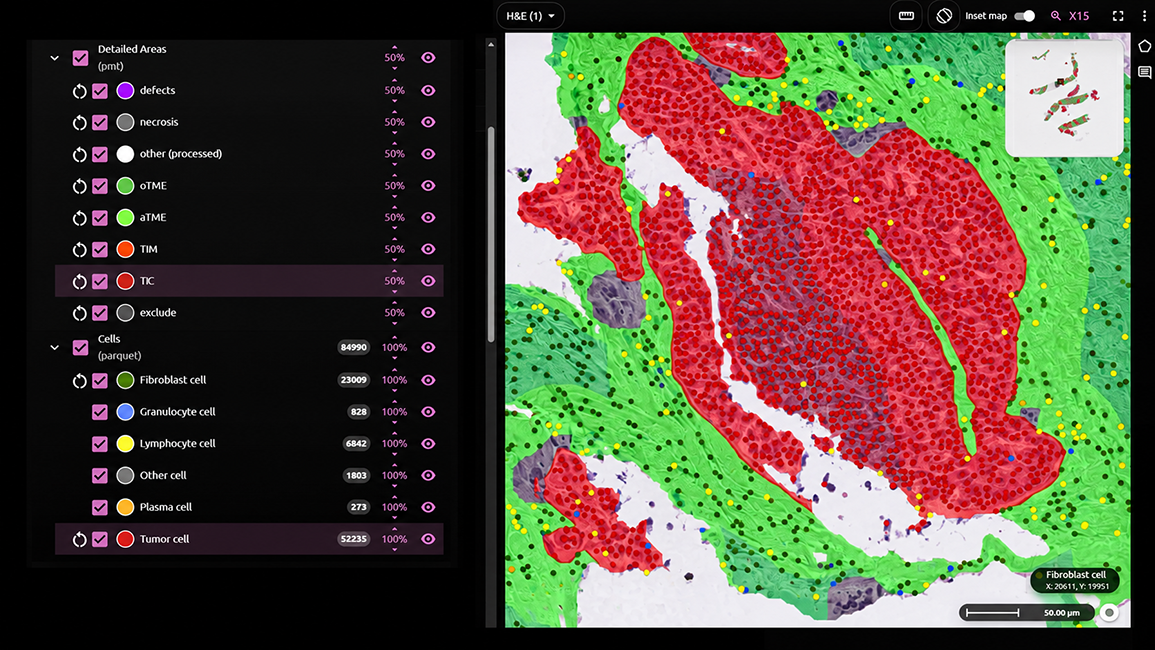
H&E is the foundational pathology modality — routinely available for every patient.
AI-powered analysis detects and classifies cells, and segments tissue into regions, including tumor, stroma, necrosis, tumor core, tumor-stroma interface, and surrounding microenvironment. From these maps, Nucleai’s platform quantifies:
- Immune context: TIL density and distribution, immune phenotypes, TLS-associated biology
- Tumor microenvironment: cellular composition, stromal architecture, fibrosis, spatial niches
- Tumor architecture & morphology: cellular and tissue-level phenotypes
- Spatial biology: tumor–immune interactions, immune exclusion, cellular proximity
- Foundation Model–Inferred Phenotypes: Infer molecular phenotypes and biological programs from H&E
Positioned for biomarker enrichment (TILs, TLS), mechanism-of-action and resistance-mechanism work.
IHC — Single-Plex
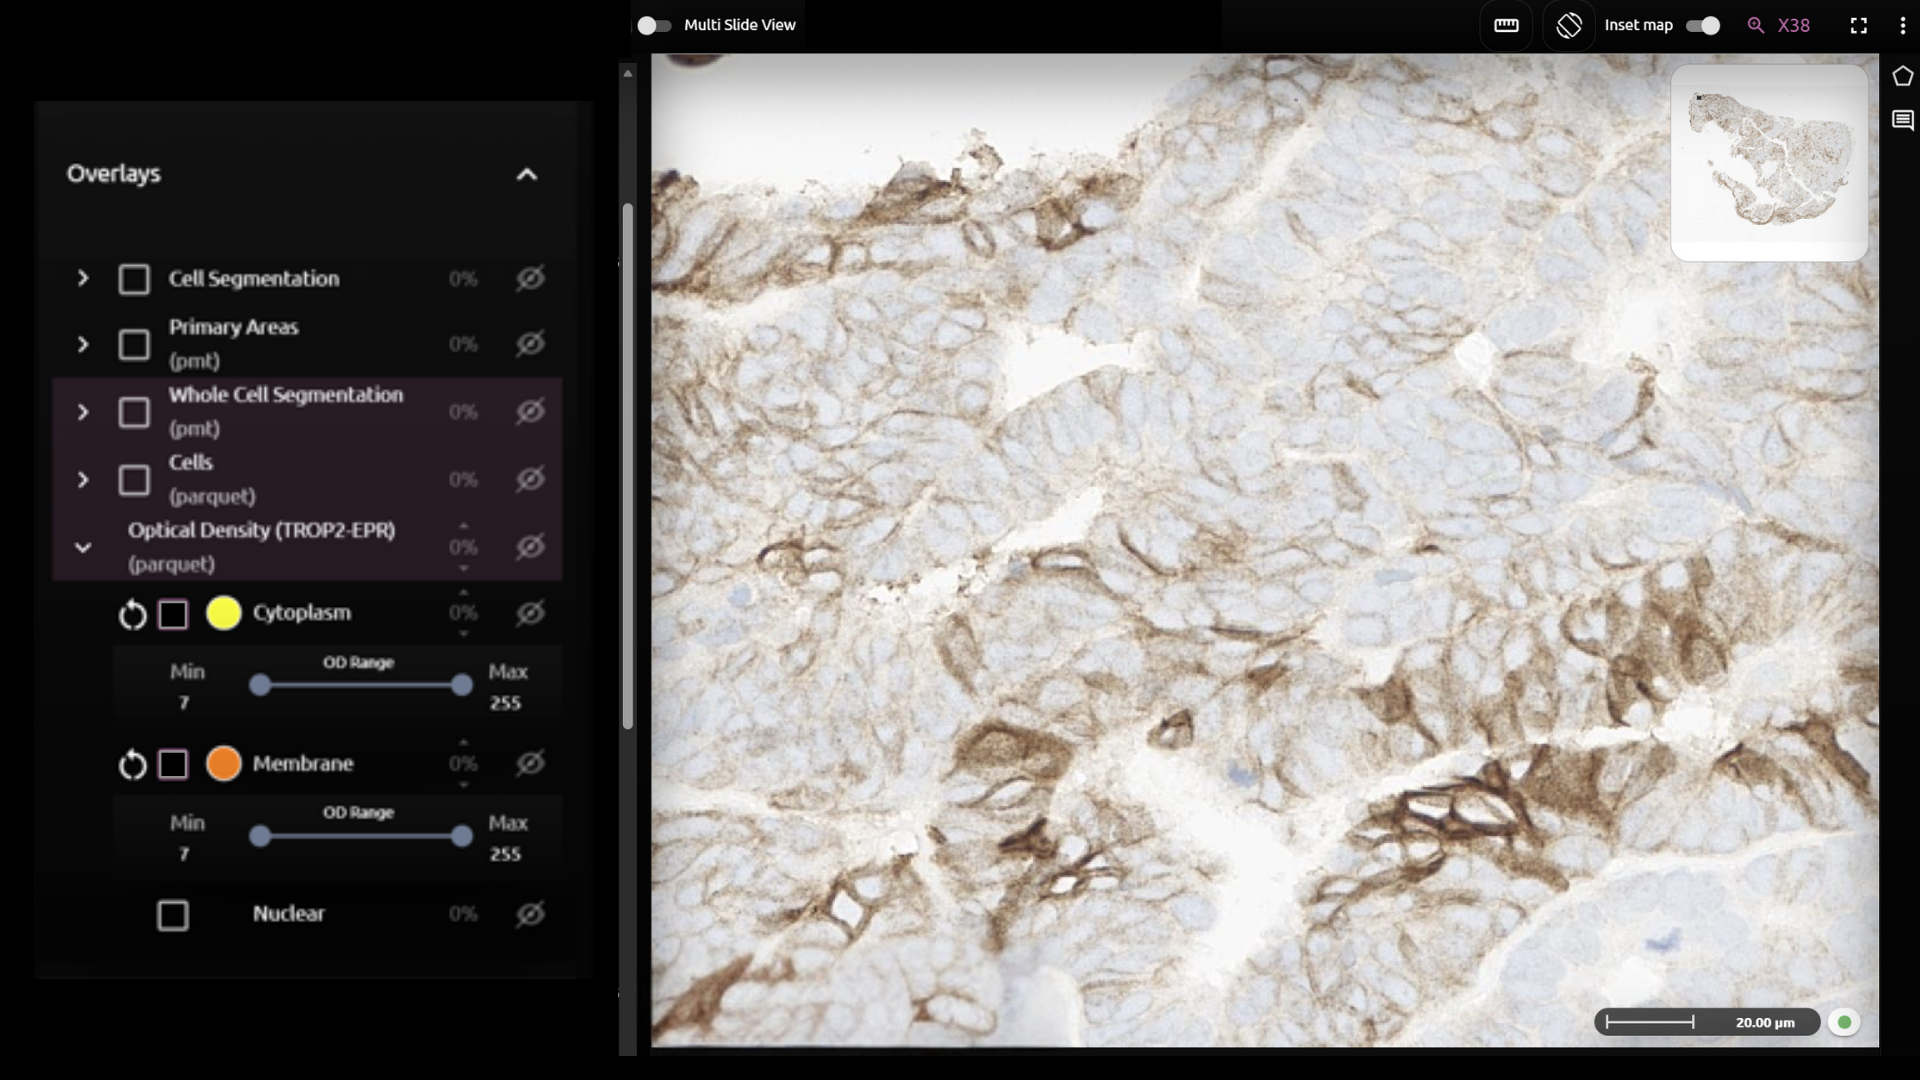
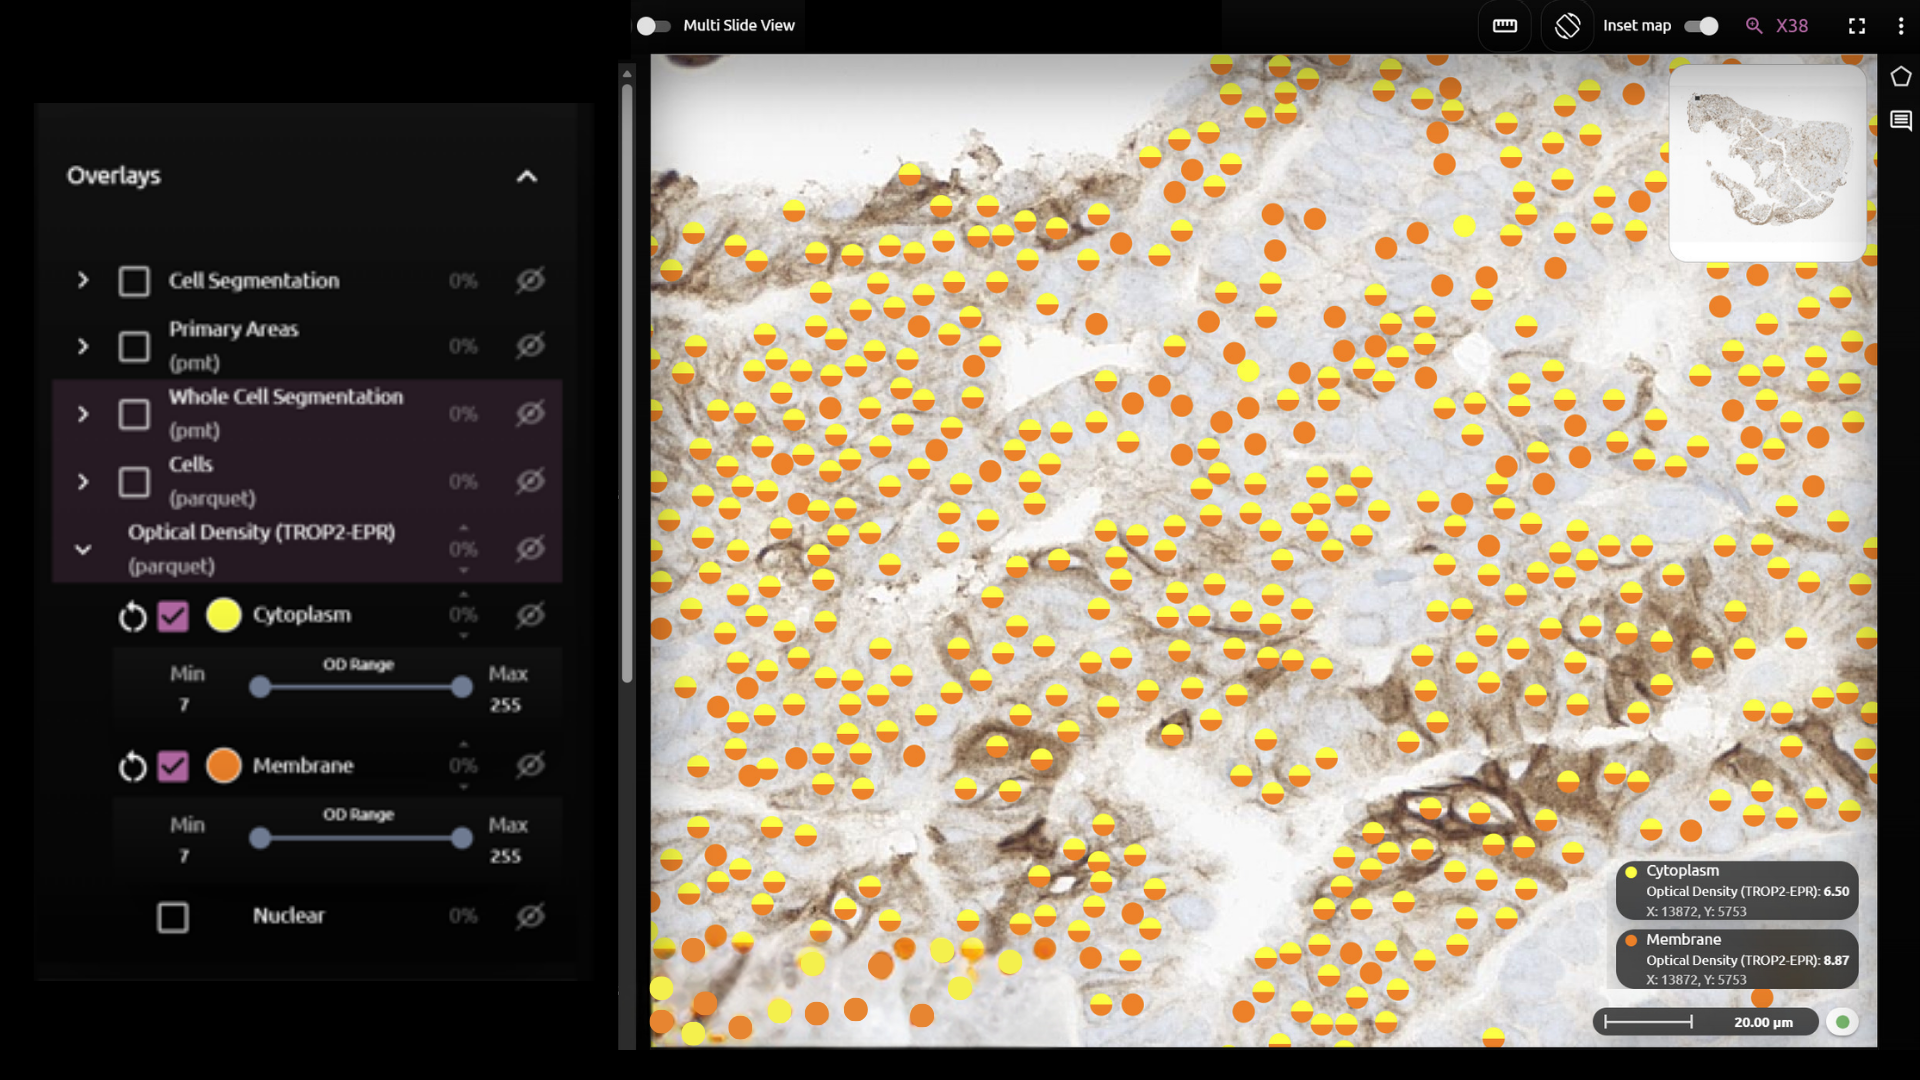
Quantitative, subcellular and spatial characterization of protein expression from conventional IHC.
Single-Plex IHC
The platform measures optical density (OD) at the individual-cell level across membrane, cytoplasm, and nuclear compartments, providing continuous expression readouts beyond conventional binned scores.
- Feature set includes: median and 10th-percentile membrane/cytoplasmic OD, nmOD, percent positivity at OD 10/30/50, H-score, Spatial Proximity Score
- Spatial Proximity Score quantifies proximity of target-positive and target-negative tumor cells, examining the bystander effect
- Applied across dozens of IHC markers and thousands of slides, spanning many diseases and therapeutic targets
- Drag the slider to compare before and after.
IHC — Multiplex / Duplex Chromogenic
Multiplex chromogenic enables protein co-expression analysis, though double-positive or co-localized cells are difficult for pathologists to read directly. Platform capabilities include:
- Color separation and enhancement
- Virtual DAB generation: deconvolving a multiplex image into per-target single-marker channels for pathologist adjudication and sign-off
- AI-augmented co-expression analysis, with per-cell, per-channel OD scoring
Case Study
For a top-10 biopharma sponsor, co-expression algorithms were developed and validated under design control against pathologist scoring at >85% agreement for clinical cutoffs, and integrated into a CLIA lab viewer — 10 validated algorithms across 10 indications.

>85%
agreement

10
validated algorithms

CLIA
lab viewer
Multiplex Fluorescence
High-plex protein imaging and transcript-level in situ hybridization (ISH), applied across panel, plex, tissue source and imaging platform.
mIF pipeline
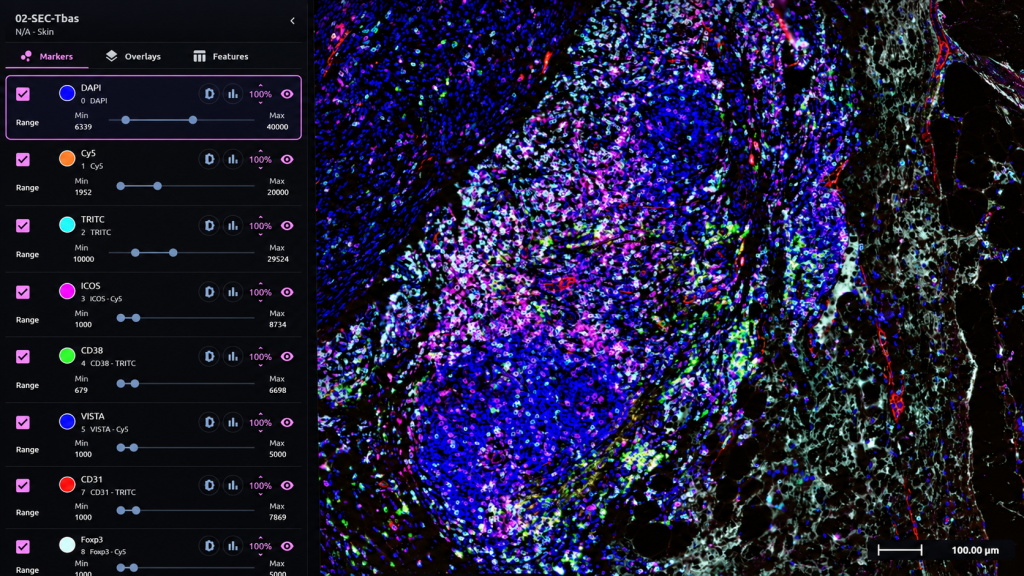
Nucleai’s platform integrates purpose-built deep learning models for whole-slide mIF analysis:
- Tissue and cell segmentation
- Signal normalization
- Single-protein and RNA quantification
- Neighborhood assignment, area modeling, spatial feature calculation
mIF classifier and results
A binary protein expression classifier, trained on 300,000+ expert annotations, learns marker expression patterns rather than relying on mean intensity. This enables more accurate protein quantification and cell typing (including rare populations) and generalizes across unseen markers, diseases, and imaging platforms.
A scalable, cloud-based platform and whole-slide viewer enables efficient analysis and exploration of large multiplex imaging datasets.
Reported performance is 92% versus a 65% average F1 against standard clustering, with the largest gains on rare cell types such as Tregs and dendritic cells. Whole-slide, tested across 10+ indications, 5+ mIF platforms and 100+ markers and clones, including Akoya PhenoImager and PhenoCycler, and Lunaphore COMET data.

300,000+
annotated cells

10+
indications

3+
mIF platforms

100+
markers and clones

Supported Platforms
RNA In Situ Hybridization (ISH)
Transcript-level ISH assays are supported. The platform detects signal at the single-molecule level, using a local- maxima algorithm that identifies intensity peaks above local background.
- FISH: single- and multiplex fluorescent RNAscope ISH
- FISH-IF: RNAscope combined with IF protein markers on the same slide
Ingestion, Across Every Modality
The platform is cloud-native and built for high-throughput cohort analysis across studies and sites.
Supported whole-slide image formats include:
.mrxs
3DHISTECH
.ndpi
Hamamatsu
.qptiff
Akoya
.tiff
.svs
Leica
Ready to Unlock MOre from your Tissue Data?